 China’s Recovery Accelerates in August
(Yicai Global) Sept. 19 -- On September 15, China’s National Bureau of Statistics (NBS) released the macroeconomic data for August, which paint a picture of an economy that is recovering rapidly but still operating below capacity.
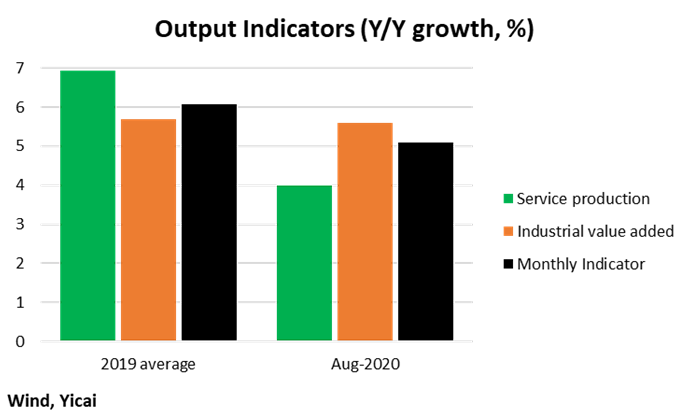
Our Monthly Indicator, which is a weighted average of the NBS’s Industrial Value Added and Service Production series, gives a bird’s eye view of the economy by estimating monthly GDP growth. It suggests that GDP grew at 5.1 percent year-over-year in August, up from 4.4 percent in July.
While the acceleration in GDP is welcome, August growth would still be a full percentage point below the 2019 average. Figure 1 below shows that sluggish service production is responsible for the weakness, as industrial value added is essentially growing at its 2019 rate.
Figure 1

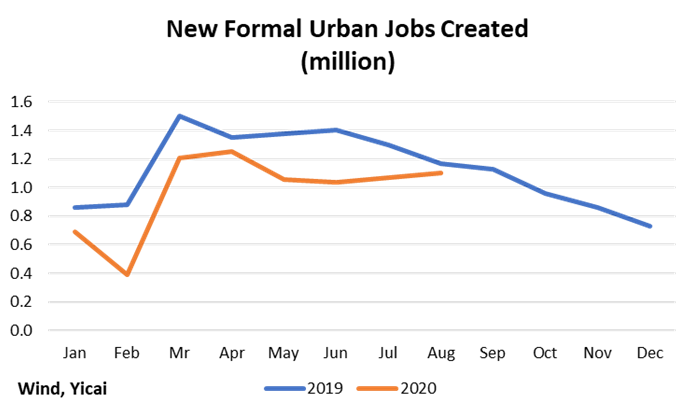
The weakness in the service sector is, to some extent, driven by insipid job creation. Figure 2 shows new formal jobs created in Chinese cities. These data exclude migrant workers and only give a partial picture of the labor market. Nevertheless, their trend is instructive. Formal urban job creation, so far this year, is only 80 percent of what we saw in 2019, suggesting a persistent labor market gap. Hopefully, in the last four months of the year, we will see the orange line cross the blue one, indicating that job creation will begin to approach last year’s level.
Figure 2

The market focused on the NBS’s retail sales data as in indicator of just how weak consumption is. After plunging 20 percent year-over-year in February, retail sales reached growth of 0.5 percent in August. While the August data point is far below the 8 percent growth that retail sales averaged in 2019, there are reasons to believe that it over-states the weakness in consumer sentiment.
Special factors have dampened retail sales growth. Lingering health concerns are still keeping diners away from restaurants. Catering industry sales were down 7 percent in August –a far cry from the 9 percent growth they registered in 2019. Nevertheless, the industry is slowly returning to health. My wife and I find Shanghai’s restaurants more crowded each week and we know it won’t be long before we have to wait at least an hour to get in to the more popular establishments.
The other special factor depressing retail sales is gasoline. However, its 14 percent decline reflects the drop in pump prices, not less enthusiasm for driving.
Taken together these special factors account for close to 4 percentage points in the decline of retail sales growth from their 2019 average to the August reading. This suggests that, on an underlying basis, retail sales growth was close to 4 percent. This is not, by any means, a strong reading, but neither is it as weak as the headline number would suggest.
The strength of consumer sentiment is also underscored by sales of big-ticket durables. Since the purchase of durables can be postponed, we see strong durable sales as de facto evidence of consumer optimism. Thus, the unit sales of passenger cars, which grew at 6 percent, on average, in May-August, compared to -10 percent in 2019, certainly reflects well on the Chinese consumer.
In the same vein, the volume of new home purchases are up 14 percent in May-August, compared to only 2 percent growth in 2019. This also indicates that households are not afraid to spend.
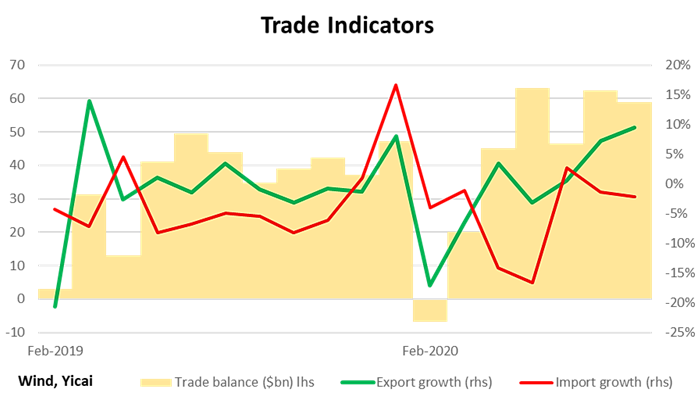
Figure 3 shows that net exports are increasingly supporting the economy. China exports to a diversified set of countries and its sales are accelerating everywhere, likely because the Chinese economy is the most exportready.
China’s trade surplus reached an all-time high in May and the surpluses in July and August were just a touch smaller. Some of the weakness in China’s imports and the size of its trade surplus can be explained by falling oil prices. In addition, there is also evidence that domestic firms are increasingly replacing foreign ones as suppliers of key inputs used to produce export goods. Taken together, lower oil prices and import substitution inflated the May-August trade balances by close to $15 billion per month. In other words, without these two factors, this year’s large trade balances would look pretty similar to what we saw in May-August 2019.
Figure 3

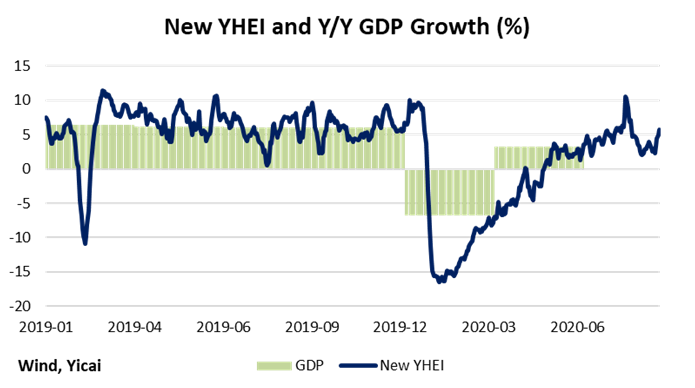
We can take a second look at the August data through the lens of our Yicai High-Frequency Economic Indicator (YHEI). The YHEI uses eight daily data series to get a real-time picture of the evolution of the Chinese economy. You can read about its construction here. The publication of one of our component series – coal consumption at major power plants – was recently discontinued. As a result, we have re-estimated our model using coal transportation data as a proxy. We find that the new model explains GDP growth just about as well as our original version.
The YHEI suggests that GDP growth in August reached 5.4 percent, up from 4.1 percent in July (Figure 4). These estimates are very close to those of the Monthly Indicator cited above, even though the data they are based on are very different. With two weeks of data, the YHEI indicates a slowdown, to 3.5 percent, in September.
Drawing on the data to date, the YHEI predicts that GDP growth in the third quarter could accelerate to 4.5 percent, up from 3.2 percent in 2020Q2. While the pick up in growth would certainly be good news, it implies that the Chinese economy would still be about 1½ percent below its productive capacity.
Figure 4
